There are numerous methods for automatically converting raw data into digital on-screen graphics, and this post will show you how.
Gone are the days of live on-screen graphics being reserved for high budget TV stations. Nowadays it’s possible for anyone to display live-data graphics to their audience using publicly available software. This blog will teach you how to make your broadcast come to life by integrating live-data solutions with software (that you probably already own) to create a dynamic, up-to-date broadcast.
What is a data graphic?
In the world of live broadcast, a data graphic is any on-screen graphic that displays information to the audience. Scrolling text fields, scoreboards, and race positions are all examples of data graphics.
Why is data integration important?
Live data is a vital aspect of any broadcast, as it allows you to keep your audience informed with up-to-the second information. Certain topics, such as breaking news stories, can usually be introduced with a reusable image. But some situations call for statistics, times, and other data points that are difficult to present with words alone. It is for just that reason that data graphic integration systems exist- to quickly convert raw numbers into easily digestible graphics for your audience. Furthermore, driving your data directly from the source means you don’t need to bake it into your graphics and render them out manually.
How does graphic data-integration work?
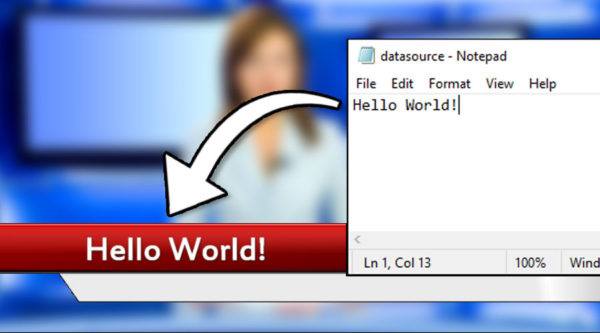
In almost all cases, the basic principle of graphic data integration remains the same: A file on your computer or network containing raw information gets read by your broadcast software and displays that data live, on-screen during your broadcast. The file, usually a .txt or .csv file, must be properly formatted, and the broadcast software can display a backing graphic, text formatting template, or even an intermediary program that brings all of these elements together. The fact that the file does not necessarily need to be hosted locally means that you have the freedom to let someone (or some computer) halfway across the world update the information in your broadcast, simply by changing lines in a plain text or spreadsheet file.
Where do you get graphics from?
Depending on what options are available to you, there are a number of methods for attaining backing graphics for your data. Programs like Adobe’s Photoshop and After Effects can be used to render out graphics ahead of time, and then your broadcast software can overlay the text from your data file on top of them. Programs such as Titler Live that act as an intermediary between your data files and your broadcast software come with an assortment of built-in graphics, and allow you to assign data fields from your raw data files directly to the graphic themselves.
When do you need data graphics?
Nearly every live broadcast can benefit from the use of data graphics. Talk shows use them to pull in social media comments, sports broadcasts use them to display scores and stats, and news broadcasts often use them to display polling numbers during election season. There is no easy answer for exactly what type of data graphics you will need on your show- It is entirely up to you to determine what your audience wants to see.
Who can help me learn more about data graphics?
NewBlue is currently leading the way in data graphic integration. Click here to learn more about how NewBlue can take your on-air graphics to the next level.