If you cover the elections in your live stream, up-to-date graphics are a vital component of election broadcasts. Here’s what you need to know:
If you are covering the election, keeping your audience informed with up-to-the-minute information is a necessity. The prevalence of breaking news stories and the volatility of poll results creates a challenge for broadcasters, where graphics are usually rendered out well in advance of the show. The world of election graphics can get complicated fast, so this blog has been written to get you started faster. If you need a primer on how data graphics work before jumping into the election, click here for an introduction to data graphics that will catch you up to speed.
1. Use plain .txt files to display scrolling text
Plain text is the most straightforward (although not necessarily the easiest, once you’re familiar) method of integrating raw data into your election broadcast. Almost every broadcast software (OBS, Wirecast, vMix, etc…) has the ability to add a Text Source overlay. Within the properties of that text source is the option to “read from file”, such as a text file. Simply select that option and the software will display the contents of that .txt file onto the screen. Additional properties for the text will include font, size, location, and more depending on which specific software you are using. In each case, you should add a new image or video source to operate as the graphical backing and play it in at the same time as your text.
A popular use example of this method is RSS feeds displayed as news tickers, which can be a useful tool for keeping your audience apprised of live poll numbers. These text files can be updated automatically by services, manually by yourself or someone with access to your network, or even through custom-built API’s used in-house. The possibilities are limitless.
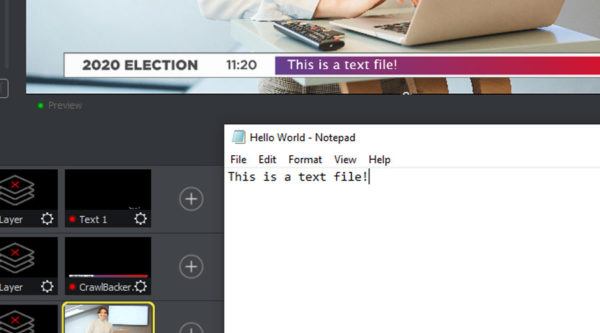
Wirecast (like most broadcast software) allows you to display your text file’s contents over a graphical backing. Additional options include text scrolls and drop shadows.
2. Develop controllers for public APIs to call-in free information
API stands for Application Programming Interface. Many services release public API’s to integrate with private solutions. For example, Facebook’s API allows developers to write plugins that display names, profile pictures, and comments from a live video. This means that with the right software, stream operators can click on a Facebook comment and push all of its data into a live graphic immediately. From a broadcast operator’s standpoint, APIs themselves are not a direct solution for displaying live data. Instead, they are utilized by software developers to create custom modules for the service they are provided by. But in larger operations, it is not uncommon to have an in-house developer create a plugin for their broadcast software that utilizes APIs to display data quickly.
Pulling user comments from social media sites is one of the most common uses of APIs. Including user feedback in your election broadcast is a great way to create audience engagement. A good example of this lies within Titler Live. The Social Pro interface is powered by the Facebook Live API, and enabling Social Pro allows you to tie comment data to a pre-built graphic template. By linking the name, image, and comment fields of Facebook’s API to the corresponding elements in the graphic, you can easily display Facebook comments in a variety of graphical formats.
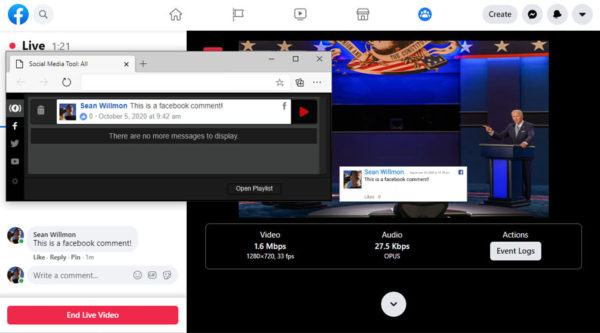
Titler Live’s Facebook Comment controller is powered by Facebook’s API, and allows users to call in comments on live videos with a single click.
Of course, Facebook is just the easiest to understand example of this process. This wikipedia article contains a list of news media APIs that are available to the public, many of which will contain stories relevant to the election as it draws nearer. The data contained in the API is unique to each API.
3. Use .csv or Excel files to host complex tables
CSV files are good for displaying spreadsheet data in a widely recognized format. CSV stands for “Comma Separated Values” and in reality, is little more than a text file that can be displayed as a spreadsheet using commas as a means to delineate cells. You can also use Excel to manually create CSV files, or take advantage of a variety of services that can export CSV’s to view spreadsheet data.
One example of this is the creation of a “Lower Thirds” document. Using vMix, you can assign a CSV file containing each news story in your broadcast to a single graphic, and simply click through the different titles as the stream progresses, without needing an individual graphic rendered out for each one. One benefit of this method is that the file containing the titles can be outsourced to a third party and integrated into the broadcast in real time.
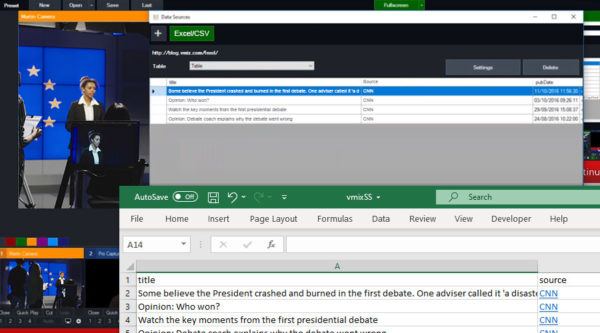
vMix has a built in spreadsheet function, which allows you to link your CSV and Excel files to a graphic, so different data fields can be called up or played through automatically.
4. Save Time With A Dedicated Live Titling Solution
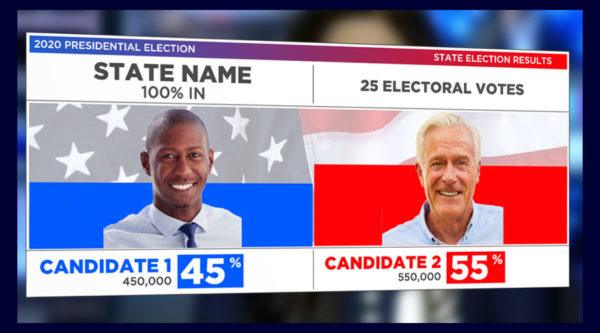
While most broadcast solutions come with the ability to integrate live data into their graphics, most are limited in the number of variables that can be driven into a single graphic, if not by the software itself, then by the reality of assigning a large number of variables to a single animated graphic. But titling software such as Titler Live allows you to pull graphics from a built-in library of templates and tie any number of variables to the text fields within that graphic. This is an easy way to represent complicated spreadsheet data, such as poll results, in a single graphic without the need to render Photoshop or After Effects files. The output is played out directly into your broadcast software. Combining all of these features in a single interface can be an incredible time-saving tool for some broadcasters.
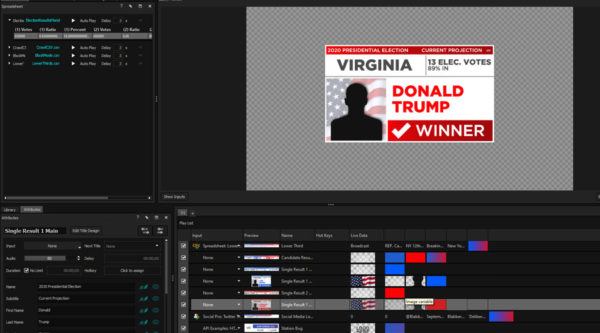
Titler Live is designed specifically for broadcast graphics. It contains a built-in graphic designer and data integration for many sources, including all of those listed above.
In order to illustrate the effectiveness of Titler Live’s ability to drive data into election graphics, we have uploaded this free package that contains a handful of useful Titler Live design files, as well as some preformatted spreadsheets to get you started. Please note, these graphics will only work for Titler Live software, and the spreadsheets will only work for Titler Live products that support spreadsheet integration (Titler Live Present, Complete, and Broadcast)
Election Graphics Pack for Titler Live
If you do not already have Titler Live, you can download a free trial version here.
Summary
As the world of broadcasts for election coverage continues to grow into the private sector, so too do your options for live data integration. And while this information may seem intimidating at first, the same basic principles apply to every workflow. Between all the different broadcast and titling softwares on the market, there exists a solution to any workflow problem you may have. The level of depth and production grows with your knowledge and experience as a stream operator, and with every phase of growth, your election broadcast will improve.