Part 2 Weather That Drives the Story —Live Data Meets Captivate WeatherCast
Part 2 of the 4 part TROY TrojanVision Series: How Troy University students turned weather into a live storytelling experience with Captivate WeatherCast.
This chapter explores how TROY TrojanVision transformed its weather segment from slide-based forecasts into a live, data-driven showpiece. Students now pull real-time weather data into Captivate WeatherCast, control pacing from the anchor desk, and use dynamic graphics to turn the forecast into a tight, storyteller-led segment that feels like a professional station.
When TROY TrojanVision decided to modernize its broadcast workflow, one of the most dramatic transformations came from the weather desk. What was once a static slideshow of temperatures and maps is now a fully live, data-driven experience — thanks to NewBlue Captivate WeatherCast. This is the story of how Troy University students turned weather into storytelling, powered by real-time data, precision graphics, and professional broadcast control.
Before the upgrade, the weather segment was… PowerPoint. Students manually assembled public-domain maps and current temps into slides. It worked, but it wasn’t live. Then Executive Producer Jeff Herring saw a tutorial on Captivate WeatherCast — and everything changed.
“My jaw dropped,” says Jeff Herring, Executive Producer of TROY TrojanVision. “We knew NewBlue was powerful, but WeatherCast was on another level — and we realized we could integrate it way deeper than we first imagined.”
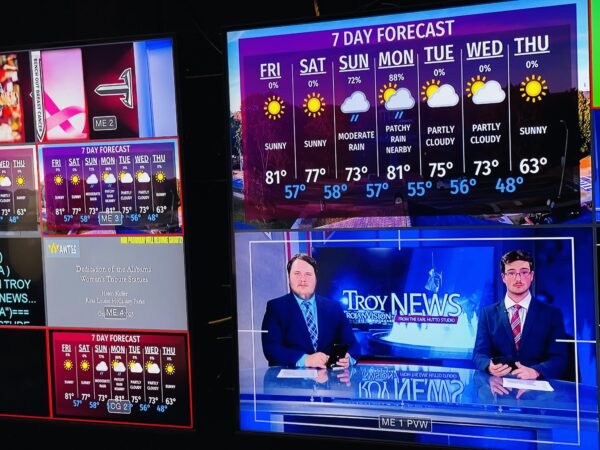
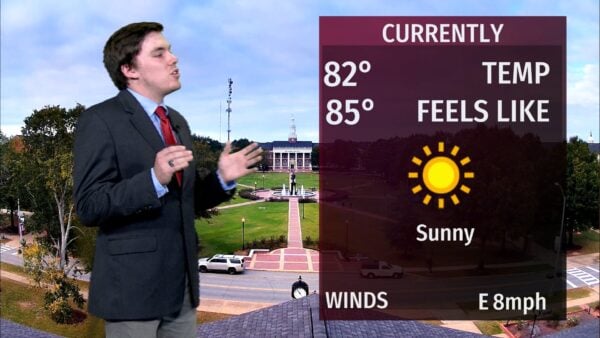
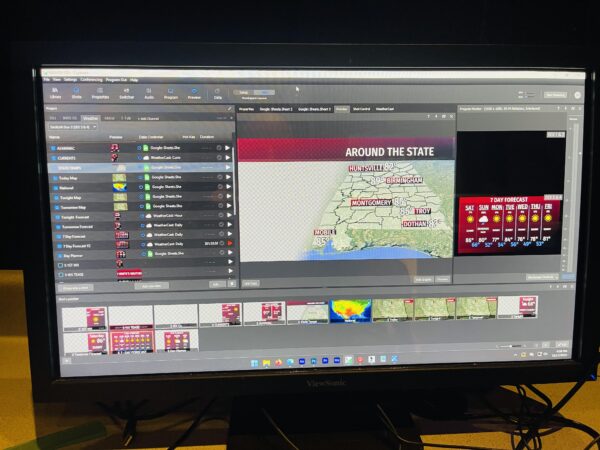
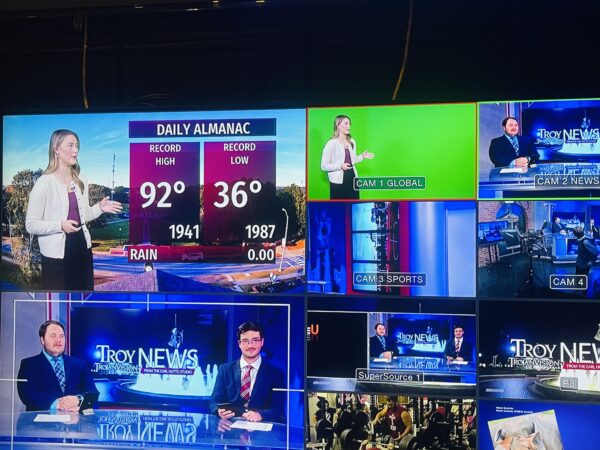
Today, TROY TrojanVision’s forecasts pull from three live data inputs — hourly conditions for snapshots, weekly forecasts for trends, and a custom Google Sheet that students update daily with local Alabama temperatures. They’ve also expanded their data presentation to include highs and lows, ‘feels like’ temperatures, humidity, UV index, and wind speeds, all sourced live or entered directly into Captivate’s linked spreadsheet. NewBlue Captivate handles it all seamlessly, updating graphics in real time and blending WeatherCast and spreadsheet data for a fluid on-air experience.
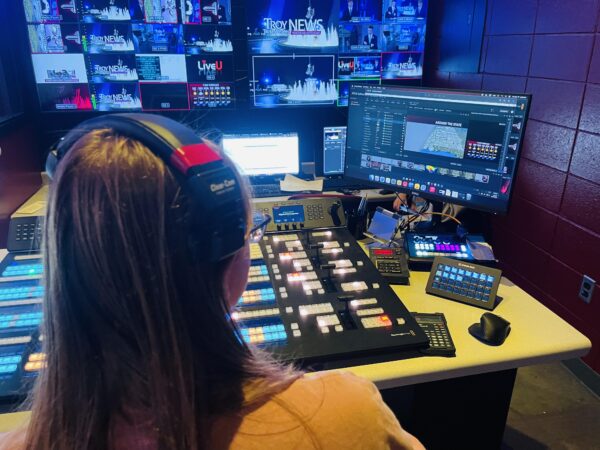
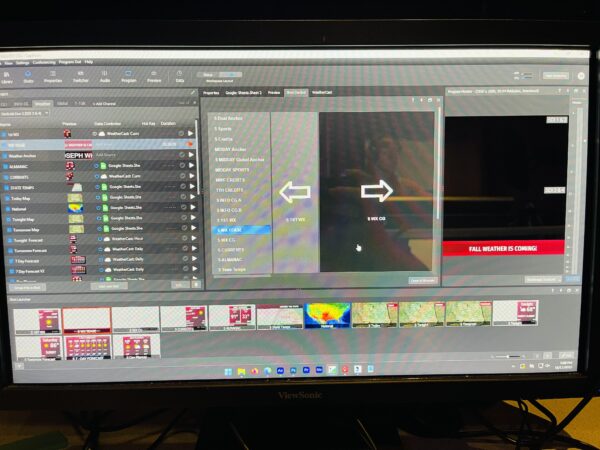
“The anchor advances graphics at their own pace using Shot Control — like a clicker in a keynote,” Herring explains. “No more ‘next, next, next’ from an operator; the storyteller drives the segment.”
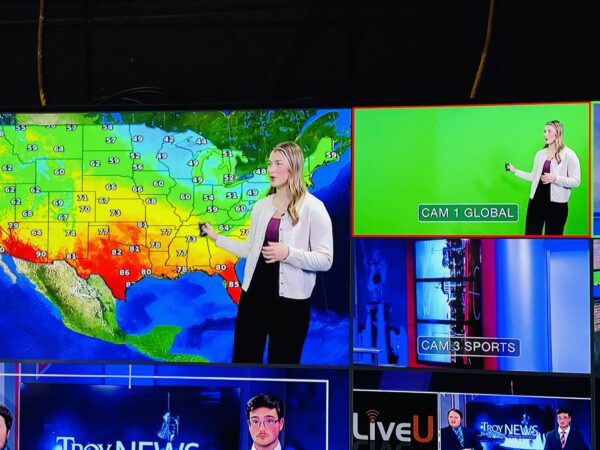
Working with NewBlue Support, Herring’s team fine-tuned their WeatherCast workflow to perform flawlessly in live conditions. “Together with NewBlue Support, they tuned WeatherCast map ingest, discovered Shot Control workflows, and refined AE+Captivate hybrid graphics when a directly exported text animation wasn’t ideal.” That partnership helped TROY TrojanVision push WeatherCast further than they thought possible — making it one of the most advanced student-run weather operations in the country.
For TROY TrojanVision, WeatherCast isn’t just a tool — it’s a storytelling catalyst. Students are learning how data becomes narrative, how visuals enhance clarity, and how technology and creativity intersect in real time. With NewBlue Captivate handling the graphics and Fusion providing the backbone infrastructure, students produce a professional-grade weather broadcast every day.
“We knew NewBlue was powerful,” Herring reflects, “but WeatherCast gave us a new level of control and creativity — it’s changed how we think about live production.”
Learn More
Discover how Captivate WeatherCast brings live data, visuals, and storytelling together for seamless on-air experiences.
👉 Explore Captivate | Discover Fusion
Up next: Part 3 – From Studio to Campus — Going Live Anywhere with Captivate, where we explore how Troy University takes live production beyond the control room—bringing professional graphics and workflows to any location on campus.
Get the backstory in case you missed it: Part 1 of the Troy University Case Study explores how TrojanVision uses Captivate in their control room to power professional, student-run broadcasts.